Gold’s Glister Fades: A Record 10-Day Slide Into Bear Territory as the "Safe-Haven Paradox" Takes Hold
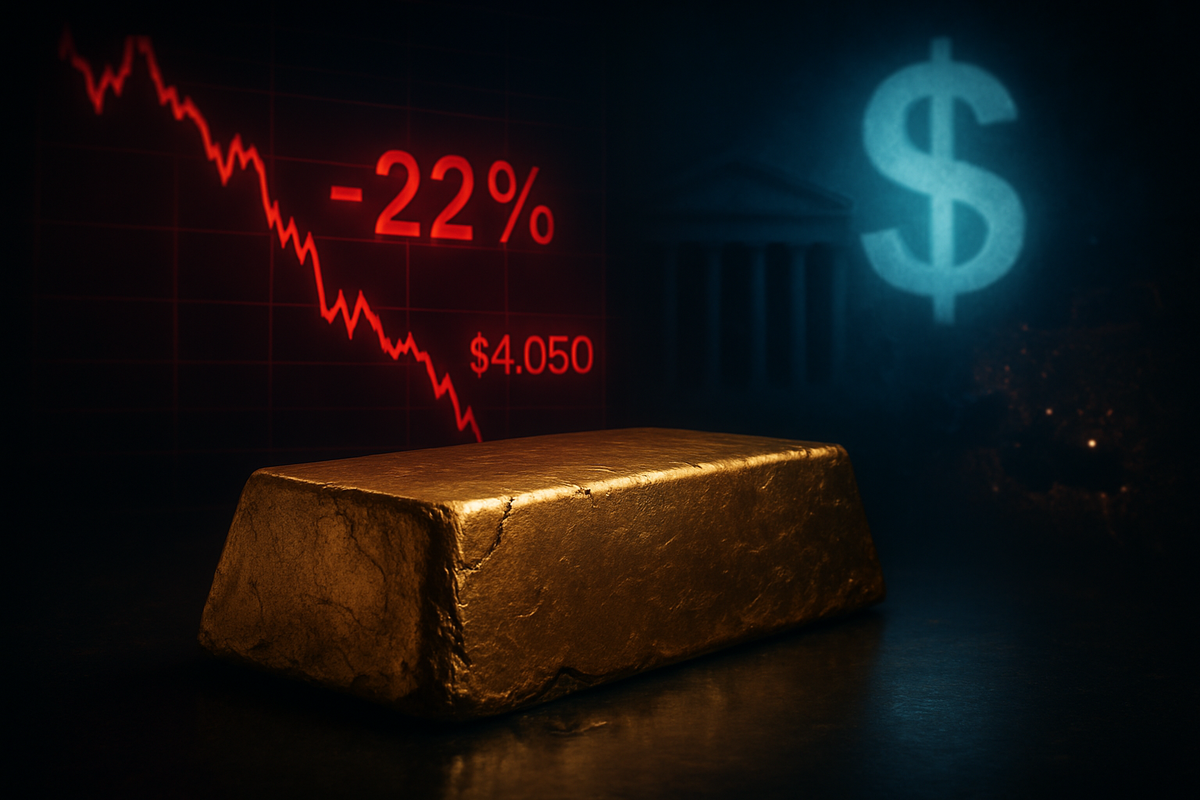
The unthinkable has happened in the precious metals market: gold, the ultimate store of value, has plunged into a technical bear market. In a stunning 10-day losing streak that has blindsided investors, spot gold prices tumbled below the critical $4,100 per ounce threshold this week. This marks a staggering 22% decline from the all-time highs of $5,595 per ounce seen just two months ago in January 2026. The swiftness of the collapse has left traders reeling, as the yellow metal failed to hold onto its psychological support levels despite a backdrop of escalating geopolitical tension.
The downturn has exposed a phenomenon analysts are calling the "safe-haven paradox." Typically, when global conflict intensifies, investors flock to gold; however, the current environment has seen the metal buckle under the weight of a relentlessly hawkish Federal Reserve and a surging U.S. Dollar. As of March 24, 2026, the traditional flight-to-safety trade has been turned on its head, with liquidity-driven selling and soaring Treasury yields proving to be more powerful than the fear of war.
The 10-Day Descent: A Timeline of Technical Ruin
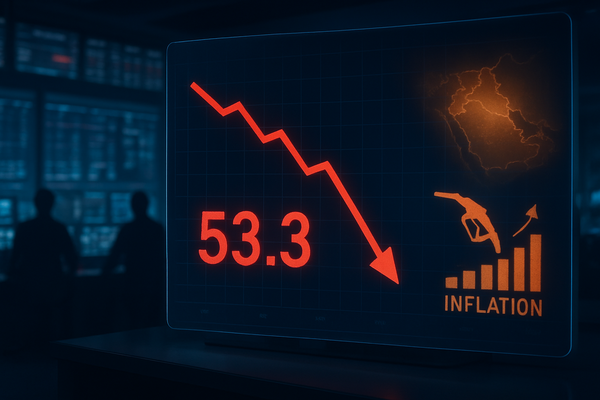
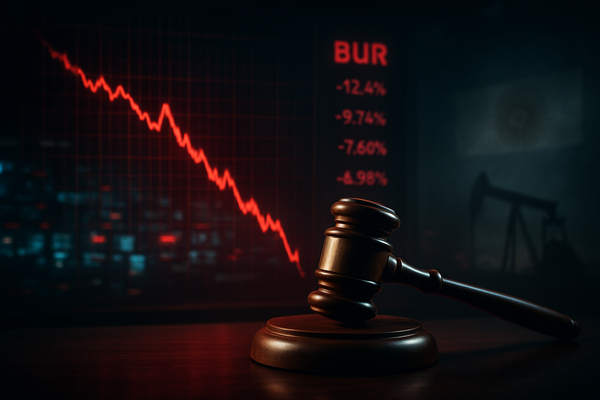
The catalyst for this historic slide was the Federal Open Market Committee (FOMC) meeting on March 18, 2026. While the market had anticipated a pivot toward lower rates to offset global economic slowing, Federal Reserve Chairman Jerome Powell delivered a "hawkish hold." The Fed maintained interest rates in the 3.50%–3.75% range but released a "dot plot" that stunned markets by signaling only one solitary rate cut for the remainder of 2026. This hawkishness was driven by "cost-push" inflation—a direct result of Brent crude oil prices surging past $115 a barrel due to the ongoing "Operation Epic Fury" conflict in the Middle East. The Fed’s refusal to blink in the face of energy-driven inflation sent shockwaves through the commodities complex.
Following the Fed’s announcement, gold entered a 10-day freefall, its longest losing streak since the early 1980s. Each day brought a new breach of support, starting with the $5,000 level and culminating in the break below the 200-day Exponential Moving Average. Key stakeholders, including institutional hedge funds and algorithmic trading desks, shifted from "buy the dip" to "sell the rip" almost overnight. By the time the price dipped below $4,100, the market was in a state of systemic liquidation, as investors across Asia and Europe were forced to dump their gold holdings to cover margin calls in cratering equity markets.
The pressure was compounded by the performance of the U.S. Treasury market. The 10-year U.S. Treasury yield spiked to a multi-year high of 4.38%, significantly raising the opportunity cost of holding a non-yielding asset like gold. Simultaneously, the U.S. Dollar Index (DXY) regained its status as the "deepest liquidity haven," effectively cannibalizing the demand that would usually flow into precious metals. In this high-yield, high-dollar environment, gold’s role as a hedge against instability was simply outmatched by the sheer math of rising interest rates.
Miners and ETFs: The Collateral Damage of the Gold Crash
The technical bear market has sent tremors through the equities of major gold producers, which often trade as a leveraged play on the underlying metal. Newmont (NYSE: NEM) has seen its market capitalization take a significant hit, with shares trading roughly 26% lower this month. While Newmont’s All-In Sustaining Cost (AISC) remains relatively healthy at a projected $1,680 per ounce for 2026, the rapid erosion of the spot price has forced analysts to slash earnings estimates. Investors are no longer rewarding production volume; instead, they are scrutinizing balance sheets for resilience against sustained high interest rates.
Barrick Gold (NYSE: GOLD) has faced similar headwinds, with its stock price mirroring the 20% plus decline seen in the spot market. The "Great Decoupling" of the mid-2020s, which saw miners improve their margins, is now being tested by a "washout" of speculative positions. For companies like Franco-Nevada (NYSE: FNV), which operates on a royalty and streaming model, the price drop represents a direct hit to future cash flow projections, despite their lack of direct exposure to rising mining operational costs. The sentiment has shifted from aggressive growth to defensive preservation across the entire sector.
The investment vehicle market has perhaps been the most volatile. The SPDR Gold Shares (NYSEARCA: GLD) recorded a staggering $2.91 billion single-day outflow in mid-March, the largest such liquidation in over a decade. Similarly, the iShares Gold Trust (NYSEARCA: IAU) has seen massive redemptions as retail investors pivot toward high-yield money market funds and short-term Treasuries. The exodus from gold ETFs highlights a fundamental shift in the 2026 market psyche: when cash pays 4% and gold is in a freefall, the "pet rock" narrative—fair or not—tends to resurface with a vengeance.
Analyzing the Significance: The Safe-Haven Paradox and Historical Precedent
The current crisis represents a fundamental break from historical norms, specifically what economists are calling the "Safe-Haven Paradox." Historically, geopolitical shocks like the current Middle East conflict act as a primary tailwind for gold. However, in 2026, the nature of the conflict—focused on energy corridors—has created a feedback loop that benefits the U.S. Dollar over gold. Because the war drives up energy prices, it keeps inflation "sticky," which in turn forces the Federal Reserve to keep interest rates high. This high-rate environment is toxic for gold, creating a scenario where more war actually leads to lower gold prices.
This situation echoes the market dynamics of 2013 and 2022, but on a much larger scale. In those years, gold also struggled against a backdrop of rising rates, but the 2026 bear market is unique due to the sheer volume of "paper gold" and ETF participation that did not exist in previous decades. The rapid liquidation of these instruments has accelerated the price drop, creating a self-fulfilling prophecy of technical breakdowns. Furthermore, the global "liquidity squeeze" has meant that gold is being used as a source of cash rather than a store of value—a classic sign of a systemic market panic.
The regulatory and policy implications of this move are also significant. Central banks, particularly in the BRICS nations, which had been record buyers of gold throughout 2024 and 2025, are now facing massive mark-to-market losses on their reserves. This could potentially slow the trend of "de-dollarization," as the U.S. Dollar’s dominance during this period of extreme stress reinforces its role as the global reserve currency. If gold cannot provide protection during a regional war and an inflation spike, policymakers may begin to question its long-term utility in a modern digital economy.
The Road Ahead: Potential Pivots and Scenarios
In the short term, the market is looking for a floor. Technical analysts suggest that $4,000 per ounce is the "line in the sand" that must hold to prevent a total capitulation toward the $3,800 level. Much will depend on the next set of inflation data; if consumer prices show signs of cooling despite high energy costs, it might give the Federal Reserve the cover it needs to soften its tone. A shift toward a more dovish "neutral" stance could spark a violent short-covering rally, given how oversold the metal has become on a daily and weekly basis.
Longer-term, the gold mining industry will likely undergo a period of forced consolidation. With stock prices depressed, larger players like Newmont and Barrick may look to acquire smaller, Tier-2 producers who are struggling with higher debt costs. For investors, the challenge will be identifying when the "Safe-Haven Paradox" has run its course. If the Middle East conflict escalates further or begins to impact the physical supply of gold from key refining hubs, the physical market could eventually decouple from the paper market, leading to a massive premium for actual bullion.
The most likely scenario for the remainder of 2026 is a period of high volatility and "base-building." Gold may need several months of trading between $4,000 and $4,300 to work off the technical damage of this 10-day losing streak. The market is waiting for a clear signal that the Fed's "higher for longer" policy has reached its terminal point. Until the 10-year Treasury yield begins a sustained descent, the upside for gold will likely remain capped by the sheer gravity of the U.S. Dollar’s strength.
Final Assessment: A New Era for Precious Metals
The entry into a technical bear market in March 2026 marks a watershed moment for precious metals. The myth that gold always rises during times of war has been thoroughly debunked by the reality of modern monetary policy and the "Safe-Haven Paradox." While the 10-day losing streak was a traumatic event for many portfolios, it also serves as a stark reminder that no asset is immune to the forces of a hawkish central bank and a strengthening global reserve currency.
Moving forward, the market must adjust to a reality where gold is viewed through the lens of interest rate differentials rather than just geopolitical fear. Investors should keep a close eye on the U.S. Dollar Index and the 10-year yield, as these have become the primary drivers of gold’s price action, superseding even the most dire headlines from the Middle East. The resilience of the $4,000 level will be the ultimate test of gold’s enduring relevance in the mid-2020s.
Ultimately, the gold bear market of 2026 is a story of liquidity and opportunity cost. As long as the Federal Reserve remains committed to its inflation fight and the U.S. Dollar remains strong, the "glister" of gold will likely remain dimmed. For the patient investor, this washout may eventually represent a generational entry point, but in the immediate months, caution and a focus on macroeconomic fundamentals will be the keys to navigating this unprecedented market landscape.
This content is intended for informational purposes only and is not financial advice.