Gold’s $5,000 Fever Breaks: Analyzing the $4,600 Floor in the New Bull Market Era
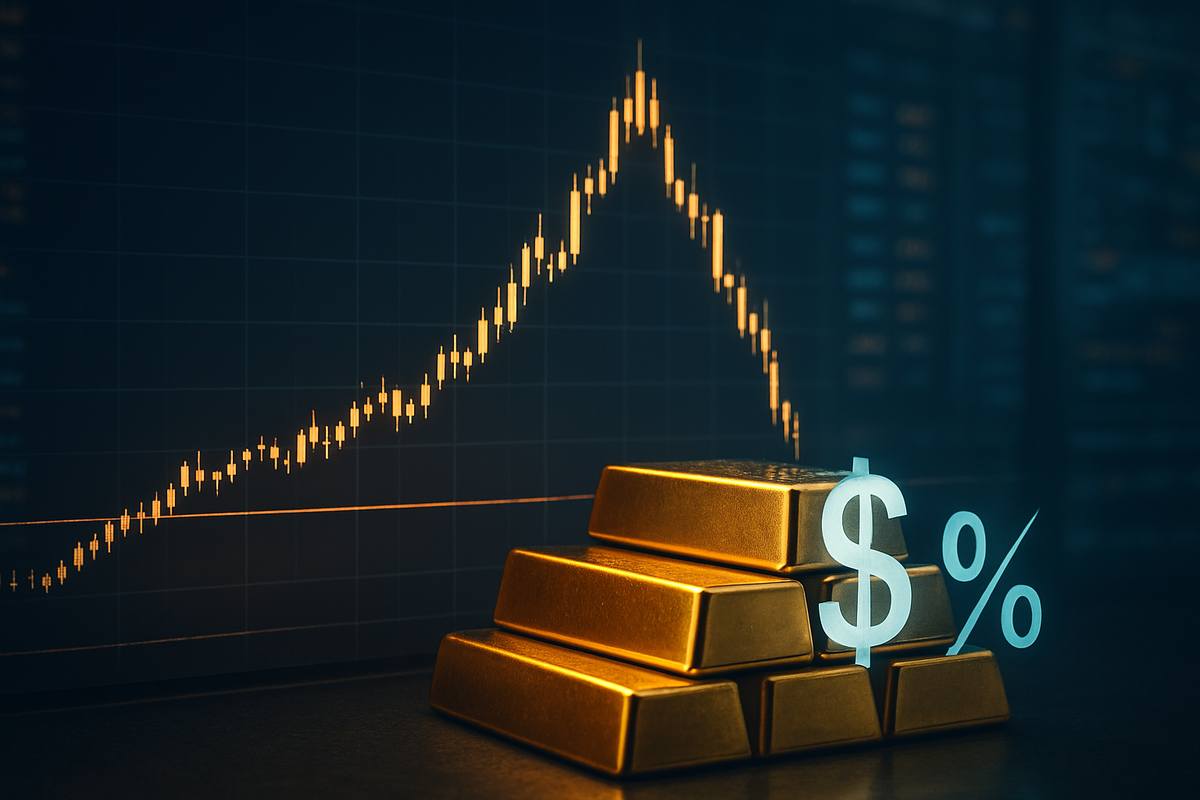
The historic surge in the gold market, which saw the precious metal shatter the psychologically significant $5,000 barrier earlier this year, has entered a period of sharp cooling. After hitting a record intraday high of $5,111 on January 26, 2026, gold has retreated to the $4,600 level as of April 1, 2026. This 10% pullback has sparked a heated debate among institutional investors: is this the end of the "Explosive 2025" rally, or a healthy correction in a long-term bull market era?
The immediate implications of this retreat are felt across the global financial landscape. While the retreat from the peak reflects a resurgence in the U.S. Dollar and a shift in Federal Reserve expectations, the underlying structural drivers—geopolitical instability and a steady march toward de-dollarization—remain in play. For the moment, the market is testing the resilience of the $4,600 floor, a level that many technical analysts believe must hold to preserve the upward trajectory established over the last eighteen months.
From Peak to Pivot: The Timeline of the Correction
The journey to $5,111 was paved by a "perfect storm" of macro-economic catalysts that defined late 2025. Aggressive global tariff shocks and escalating tensions in the Middle East created a "fear premium" that drove gold prices up by nearly 40% in a single calendar year. By late January 2026, gold was the world's best-performing asset class, fueled by central banks in emerging markets aggressively rotating their reserves away from U.S. Treasuries and into physical bullion.
However, the momentum shifted abruptly in March 2026. The primary catalyst was a surprising "Oil Shock" pivot; as energy prices surged due to supply chain disruptions, inflation expectations spiked, forcing the Federal Reserve to abandon its plans for interest rate cuts. Instead, by April 1, traders began pricing in a 54% probability of a rate hike by year-end. This hawkish turn sent the U.S. Dollar Index (DXY) up by 2%, exerting immense pressure on non-yielding assets like gold.
During this descent, gold breached several critical technical milestones. The level of $4,899, which served as a major resistance-turned-support during the late 2025 breakout, was decisively broken in mid-March. This breach triggered a wave of profit-taking from hedge funds and retail investors who had ridden the rally from $3,000. The metal is now testing a new support zone near $4,600, which aligns with its 100-day Simple Moving Average (SMA), a line in the sand for many trend-following algorithms.
Mining Giants Face a Trough Year Amidst Volatility
The volatility in bullion prices has created a complex landscape for the world’s largest gold producers. Newmont (NYSE: NEM), the industry leader, saw its shares hit an all-time high of $131.68 during the January peak but has since retreated to the $101–$108 range. Under the new leadership of CEO Natascha Viljoen, Newmont is navigating a "trough year" for production, with major maintenance at its Peñasquito and Boddington mines temporarily limiting its ability to fully capitalize on the high realized prices of early 2026.
Barrick Gold (NYSE: GOLD) has also felt the sting of the correction, with its stock price dropping approximately 32% in March alone. Despite reporting a massive $1.62 billion in free cash flow for Q4 2025, the company’s 2026 guidance was lighter than analysts expected. Furthermore, industry-wide cost pressures have pushed Barrick's All-In Sustaining Costs (AISC) guidance to between $1,760 and $1,950 per ounce, making the $500 drop in gold prices a significant threat to its bottom-line margins.
In contrast, Agnico Eagle (NYSE: AEM) has emerged as a relative "safe haven" within the sector. While it corrected from its March 52-week high of $255.24 to the $185 range, its superior operating margins of nearly 49% provide a larger cushion against price swings. Investors are also keeping a close eye on royalty and streaming companies like Franco-Nevada (NYSE: FNV), which tend to be less sensitive to the operational cost spikes currently plaguing the major miners, though they remain tied to the overall price action of the metal.
Macro Significance and the "Bull Market Era" Context
The current drop to $4,600 must be viewed within the broader context of the "Bull Market Era" that began in 2024. Historically, gold rallies of this magnitude are often followed by sharp corrections as the market "digests" gains. The significance of this event lies in the shift of the U.S. Treasury yield curve; nominal 10-year yields have surged to 4.44%, while real yields have climbed to 2.13%. In any other era, such high real rates might have sent gold back to $2,000, yet the metal remains comfortably above $4,500.
This resilience points to a structural change in the market: the decoupling of gold from traditional U.S. interest rate metrics. The ripple effects are being felt in the currency markets, where the dollar’s strength is increasingly viewed as a temporary liquidity squeeze rather than a sign of long-term health. Central bank demand remains the ultimate backstop; despite the price drop, major institutions in Asia and Eastern Europe have shown no signs of slowing their gold accumulation, viewing the $4,600 level as a strategic entry point.
Comparing the current environment to the 1970s "Great Inflation," analysts note that gold often experiences multi-month pullbacks even within a secular bull market. The policy implications are clear: as long as global debt levels continue to climb and trade wars persist, gold's status as a neutral reserve asset will likely outweigh the short-term headwinds of a hawkish Federal Reserve.
The Road Ahead: Tactical Opportunity or Trend Breakdown?
Looking forward, the next three months will be critical for determining if the current drop is a "buy the dip" opportunity or the start of a deeper bear phase. If gold can successfully consolidate between $4,550 and $4,600, it would set a technical base for a move back toward the $5,000 level by late 2026. Short-term, the market will be hyper-sensitive to any softening in U.S. labor data or a cooling of the recent "Oil Shock," either of which could prompt a rotation back into bullion.
Strategically, mining companies may need to pivot toward cost-containment and capital discipline if prices remain stagnant near $4,600. The "windfall" period of 2025 has provided these companies with strong balance sheets, but a prolonged consolidation will test their ability to manage rising labor and energy costs. For investors, the challenge remains balancing the near-term pressure of a strong dollar against the long-term thematic of a multipolar global financial system where gold plays a central role.
Summary and Investor Outlook
The retreat from $5,111 to $4,600 represents a classic "cooling off" period for a market that had become dangerously overheated in early 2026. While the break of the $4,899 support level was a blow to short-term momentum, the $4,600 level is currently serving as a formidable line of defense. The primary drivers of the decline—higher yields and a stronger dollar—are significant, but they face off against the long-term structural demand from global central banks.
As we move through the second quarter of 2026, investors should keep a close eye on the Federal Reserve’s rhetoric and geopolitical developments in the Middle East. If the $4,600 support holds, the consensus targets from major banks like Goldman Sachs and JP Morgan—ranging from $5,400 to $6,300—remain within reach for the 2027 outlook. For now, the "Golden Era" isn't over; it’s simply taking a much-needed breath.
This content is intended for informational purposes only and is not financial advice.